Dashboard Solutions
Executive-ready Power BI dashboards designed around questions leaders actually ask.
Executive Dashboard
Revenue, margin, profitability, customer, product, headcount and strategic sales indicators in one governed overview.
Finance Dashboard
Revenue, cost, expenses, profitability, department and location performance with drillable explanation.
HR Dashboard
Workforce overview, salary, department, location, movement and internal mobility analytics.
Sales Dashboard
Lead funnel, opportunity pipeline, top deals, renewals, close risk, sales activity and owner performance.
Manco / Opsco Dashboard
Operational leadership view across financial health, people capacity, pipeline and execution priorities.
Custom Dashboards
Industry-specific dashboards built on the same governance, tenant and KPI standards.
Dashboard module previews
Small previews below show the kind of dashboard language used across the platform: concise KPI cards, clear chart titles, governed colour choices and business-focused context.
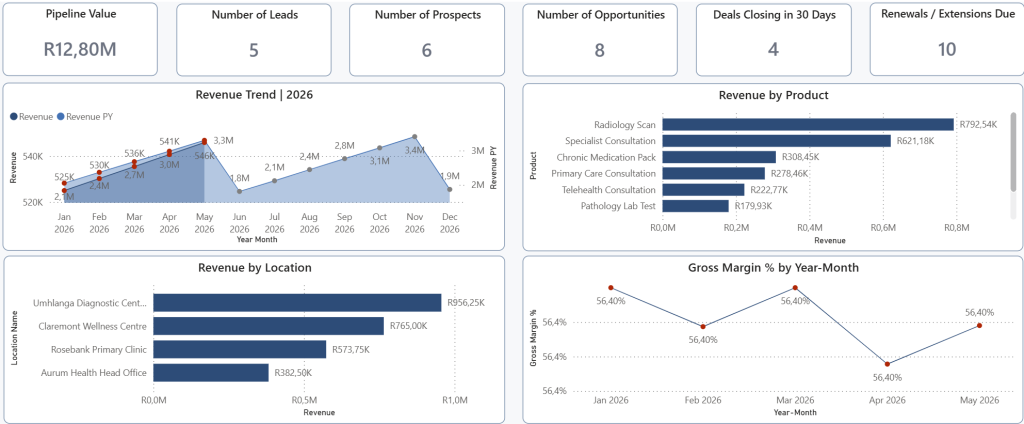
Executive revenue
Revenue, product, location and gross margin views designed for fast executive scanning.
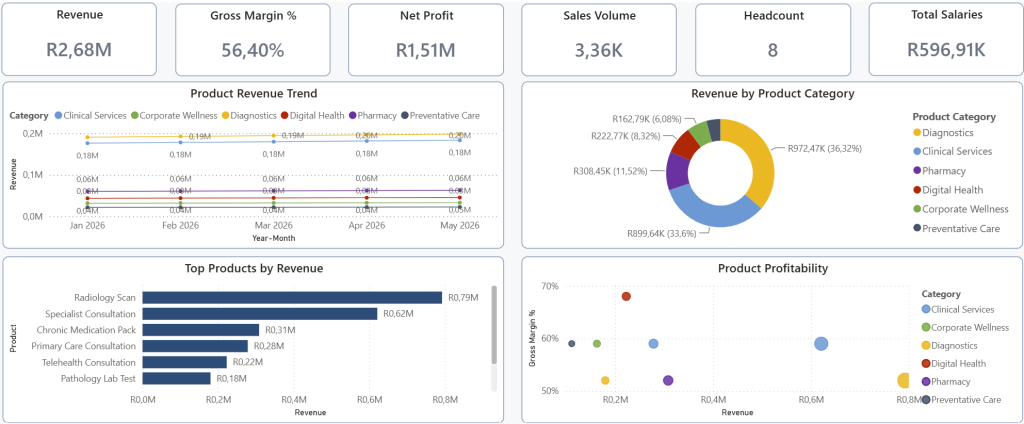
Executive product
Product revenue, category mix, top products and profitability in a consistent dashboard layer.
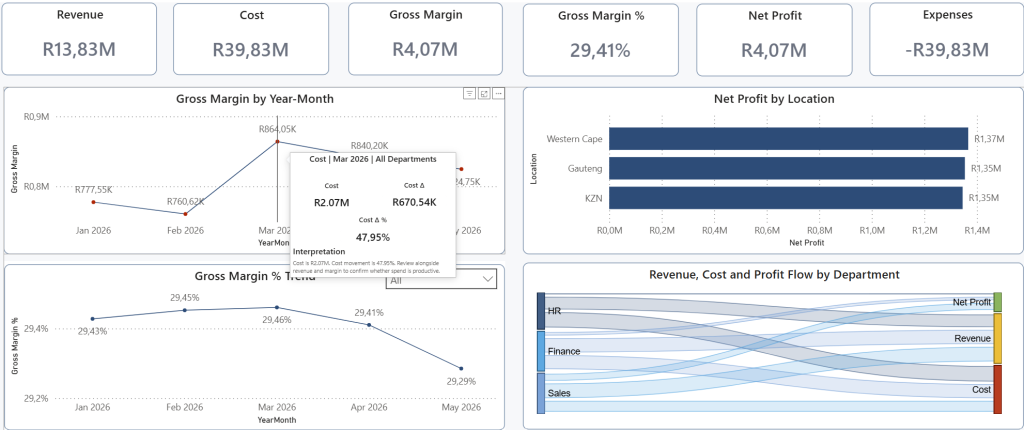
Finance profitability
Profitability trend, net profit by location and revenue/cost/profit flow by department.
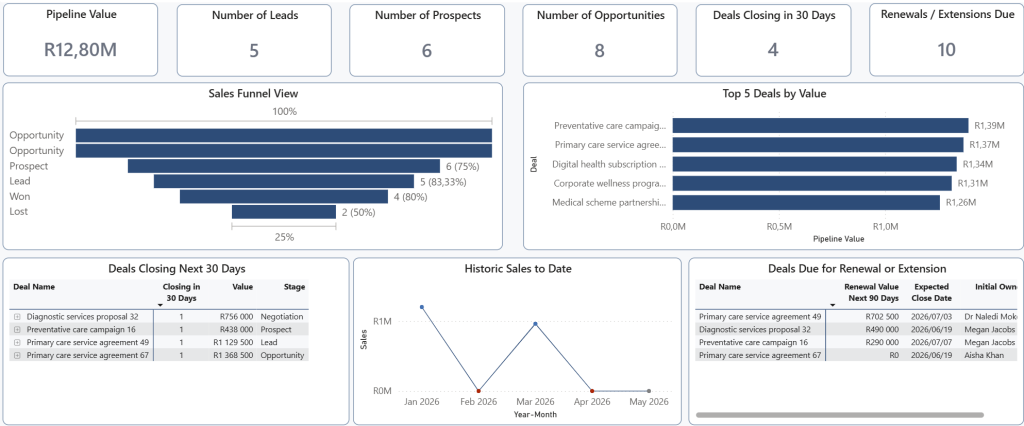
Sales pipeline
Pipeline value, funnel stage, top deals, closing risk and renewal visibility.
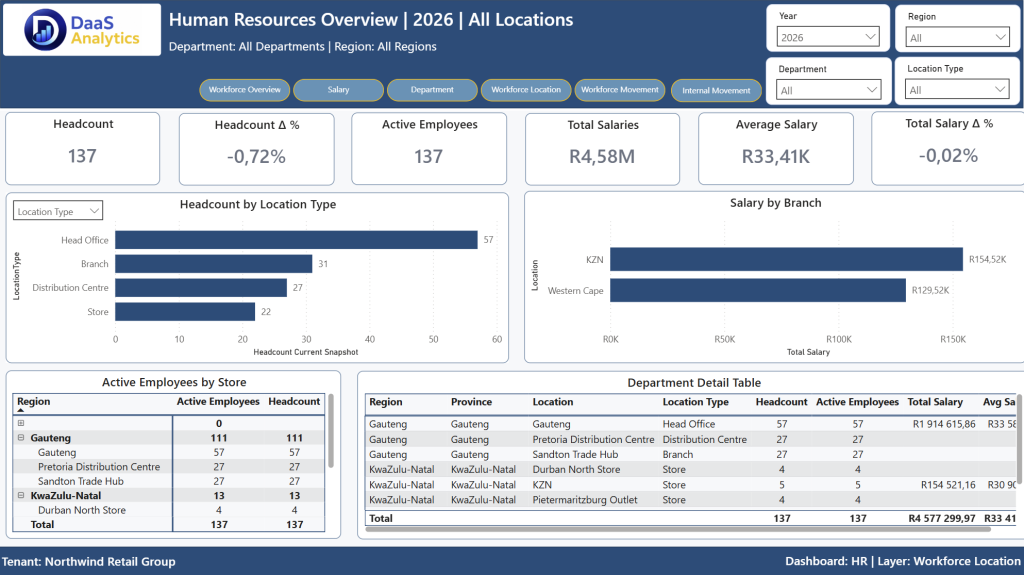
Human Resources layered dashboard
Workforce location, salary, movement and department layers show how the platform keeps the same executive UX while changing analytical context.